DOCUMENTATION 》 TEST CASES :: TEST RESULTS :: TOFFEE-Mocha-1.0.14 Development version
Here are the TOFFEE-Mocha test cases and test results of the upcoming new TOFFEE-Mocha which is still under development. The features of this TOFFEE-Mocha are discussed in the software development update: TOFFEE-Mocha WAN Emulation software development - Update: 1-July-2016
Test case1 :: 999 millisecond constant packet delay: As you can see unlike 40 milliseconds the maximum limit which existed earlier, the new 999 milliseconds delay range allows users to slow down the transfer rates even further.
kiran@HP-ENVY-15:~/temp$ ping 192.168.0.1 -s 1000
PING 192.168.0.1 (192.168.0.1) 1000(1028) bytes of data.
1008 bytes from 192.168.0.1: icmp_seq=1 ttl=64 time=2000 ms
1008 bytes from 192.168.0.1: icmp_seq=2 ttl=64 time=2000 ms
1008 bytes from 192.168.0.1: icmp_seq=3 ttl=64 time=2000 ms
1008 bytes from 192.168.0.1: icmp_seq=4 ttl=64 time=2000 ms
1008 bytes from 192.168.0.1: icmp_seq=5 ttl=64 time=2998 ms
1008 bytes from 192.168.0.1: icmp_seq=6 ttl=64 time=2997 ms
1008 bytes from 192.168.0.1: icmp_seq=7 ttl=64 time=3995 ms
1008 bytes from 192.168.0.1: icmp_seq=8 ttl=64 time=3985 ms
1008 bytes from 192.168.0.1: icmp_seq=9 ttl=64 time=3984 ms
1008 bytes from 192.168.0.1: icmp_seq=10 ttl=64 time=3984 ms
1008 bytes from 192.168.0.1: icmp_seq=11 ttl=64 time=3983 ms
1008 bytes from 192.168.0.1: icmp_seq=12 ttl=64 time=3982 ms
1008 bytes from 192.168.0.1: icmp_seq=13 ttl=64 time=3984 ms
1008 bytes from 192.168.0.1: icmp_seq=14 ttl=64 time=3982 ms
^C
--- 192.168.0.1 ping statistics ---
18 packets transmitted, 14 received, 22% packet loss, time 17007ms
rtt min/avg/max/mdev = 2000.042/3277.214/3995.537/873.965 ms, pipe 4
kiran@HP-ENVY-15:~/temp$
Test case2 :: 500 millisecond constant packet delay: With 500 milliseconds you get roughly double the performance of 999 milliseconds.
kiran@HP-ENVY-15:~/temp$ ping 192.168.0.1 -s 1000
PING 192.168.0.1 (192.168.0.1) 1000(1028) bytes of data.
1008 bytes from 192.168.0.1: icmp_seq=1 ttl=64 time=1002 ms
1008 bytes from 192.168.0.1: icmp_seq=2 ttl=64 time=1002 ms
1008 bytes from 192.168.0.1: icmp_seq=3 ttl=64 time=1002 ms
1008 bytes from 192.168.0.1: icmp_seq=4 ttl=64 time=1002 ms
1008 bytes from 192.168.0.1: icmp_seq=5 ttl=64 time=1002 ms
1008 bytes from 192.168.0.1: icmp_seq=6 ttl=64 time=1488 ms
1008 bytes from 192.168.0.1: icmp_seq=7 ttl=64 time=1481 ms
1008 bytes from 192.168.0.1: icmp_seq=8 ttl=64 time=1481 ms
1008 bytes from 192.168.0.1: icmp_seq=9 ttl=64 time=1008 ms
1008 bytes from 192.168.0.1: icmp_seq=10 ttl=64 time=1002 ms
^C
--- 192.168.0.1 ping statistics ---
11 packets transmitted, 10 received, 9% packet loss, time 10017ms
rtt min/avg/max/mdev = 1002.077/1147.151/1488.063/220.133 ms, pipe 2
kiran@HP-ENVY-15:~/temp$
Test case3 :: 500 millisecond constant packet delay + random packet delay: With constant delay (in this case 500 milliseconds) if you enable the new random packet delay feature, it will skip delay randomly few packets. Which can be controlled via random delay factor. In this case the random delay factor value is set to 1. And you can see below few packets are not delayed. Hence their ping response time almost reduced to half (i.e around 500 ms).
kiran@HP-ENVY-15:~/temp$ ping 192.168.0.1 -s 1000
PING 192.168.0.1 (192.168.0.1) 1000(1028) bytes of data.
1008 bytes from 192.168.0.1: icmp_seq=1 ttl=64 time=1503 ms
1008 bytes from 192.168.0.1: icmp_seq=2 ttl=64 time=1497 ms
1008 bytes from 192.168.0.1: icmp_seq=3 ttl=64 time=1002 ms
1008 bytes from 192.168.0.1: icmp_seq=4 ttl=64 time=1002 ms
1008 bytes from 192.168.0.1: icmp_seq=5 ttl=64 time=1001 ms
1008 bytes from 192.168.0.1: icmp_seq=6 ttl=64 time=1001 ms
1008 bytes from 192.168.0.1: icmp_seq=7 ttl=64 time=1002 ms
1008 bytes from 192.168.0.1: icmp_seq=8 ttl=64 time=1002 ms
1008 bytes from 192.168.0.1: icmp_seq=9 ttl=64 time=1002 ms
1008 bytes from 192.168.0.1: icmp_seq=10 ttl=64 time=419 ms
1008 bytes from 192.168.0.1: icmp_seq=11 ttl=64 time=1002 ms
1008 bytes from 192.168.0.1: icmp_seq=12 ttl=64 time=1001 ms
1008 bytes from 192.168.0.1: icmp_seq=13 ttl=64 time=1002 ms
1008 bytes from 192.168.0.1: icmp_seq=14 ttl=64 time=1002 ms
1008 bytes from 192.168.0.1: icmp_seq=15 ttl=64 time=1001 ms
1008 bytes from 192.168.0.1: icmp_seq=16 ttl=64 time=502 ms
1008 bytes from 192.168.0.1: icmp_seq=17 ttl=64 time=1002 ms
1008 bytes from 192.168.0.1: icmp_seq=18 ttl=64 time=502 ms
1008 bytes from 192.168.0.1: icmp_seq=19 ttl=64 time=1002 ms
1008 bytes from 192.168.0.1: icmp_seq=20 ttl=64 time=1001 ms
1008 bytes from 192.168.0.1: icmp_seq=21 ttl=64 time=1002 ms
^C
--- 192.168.0.1 ping statistics ---
22 packets transmitted, 21 received, 4% packet loss, time 21029ms
rtt min/avg/max/mdev = 419.093/974.135/1503.026/250.662 ms, pipe 2
kiran@HP-ENVY-15:~/temp$
Random Packet delay: As discussed in my VLOG/update earlier, the idea of Random packet delay is to introduce the fluctuating, bursty nature of packet flow. So here are various tests done which shows the same in action. These tests below are performed while downloading a large file by enabling random packet delay along with various values of constant packet delay.
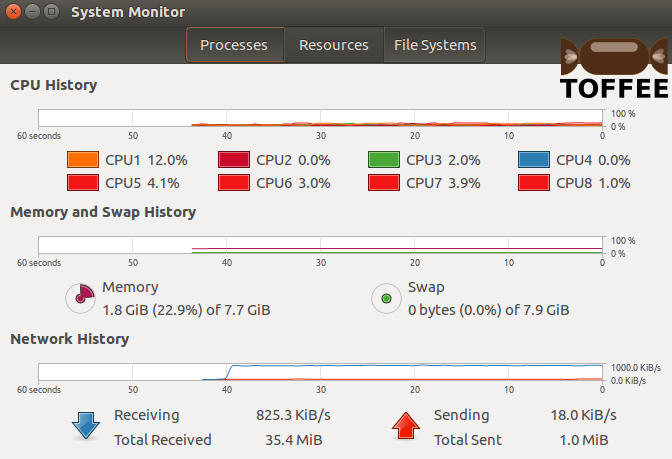
Test case4 :: 2 millisecond constant packet delay + random packet delay: With constant delay of 2 millisecond and random packet delay you can
notice the blue curve which almost appears constant. The traffic in this case is bursty but it is not that significant to notice in the graph shown below.
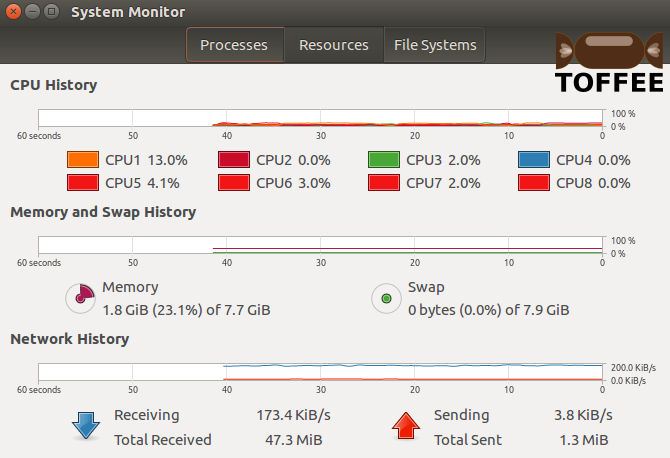
Test case5 :: 10 millisecond constant packet delay + random packet delay: With constant delay of 10 millisecond and random packet delay
you can notice the blue curve which almost appears constant. The traffic in this case is bursty but it is not that significant to notice in the graph shown
below. But it appears somewhat fluctuating than the 5 millisecond test case4 above.
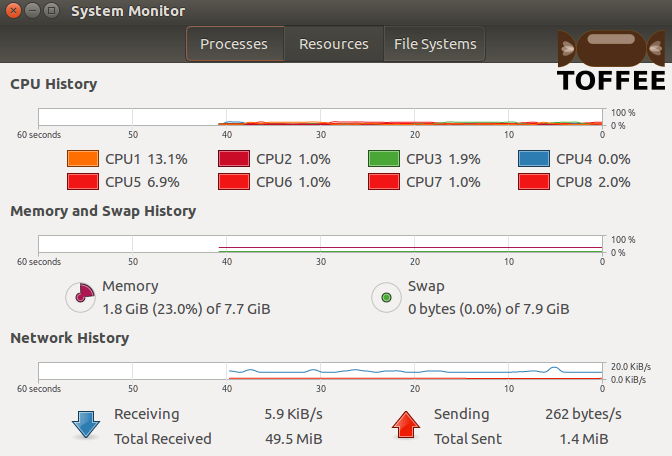
Test case6 :: 200 millisecond constant packet delay + random packet delay: With constant delay of 200 millisecond and random packet delay you
can notice the fluctuating blue curve. With this we can understand the true purpose of random packet delay.
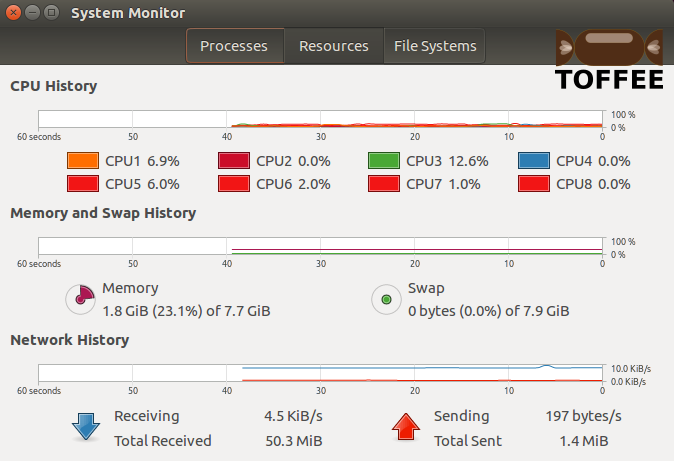
Test case7 :: 200 millisecond constant packet delay + WITHOUT random packet delay: With constant delay of 200 millisecond and WITHOUT random
packet delay feature enabled you can notice the steady blue curve. This is a direct comparison of a test case with constant packet delay 200 millisecond
with and without random packet delay. With random packet delay it makes the network performance choppy, fluctuating and bursty, but without random packet
delay feature the network performance appears almost constant.
So in my next upcoming TOFFEE-Mocha release I may include all these new features and updated old features. If you are in need of any specific feature (or scenario) you can kindly let know. If plausible and feasible I can support the same and release as a part of my upcoming TOFFEE-Mocha release. Kindly stay tuned !
Suggested Topics:
TOFFEE-Mocha - WAN Emulator
Categories
| 💎 TOFFEE-MOCHA new bootable ISO: | Download |
| 💎 TOFFEE Data-Center Big picture and Overview: | Download PDF |

Saturday' 13-Mar-2021
Saturday' 13-Mar-2021

Saturday' 13-Mar-2021

Saturday' 13-Mar-2021
Featured Educational Video:

Saturday' 13-Mar-2021

Saturday' 13-Mar-2021
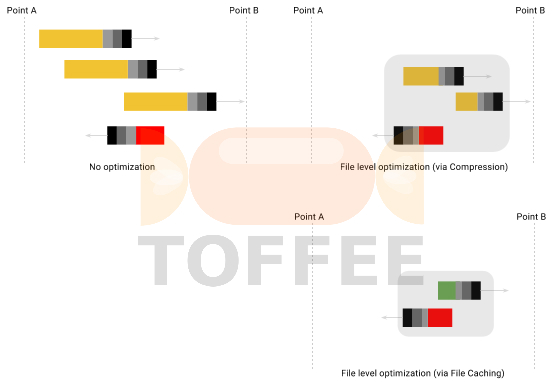
Research :: Optimization of network data (WAN Optimization) at various levels:
Learn Linux Systems Software and Kernel Programming:

Hardware Compression and Decompression Accelerator Cards:

TOFFEE-DataCenter on a Dell Server - Intel Xeon E5645 CPU:


