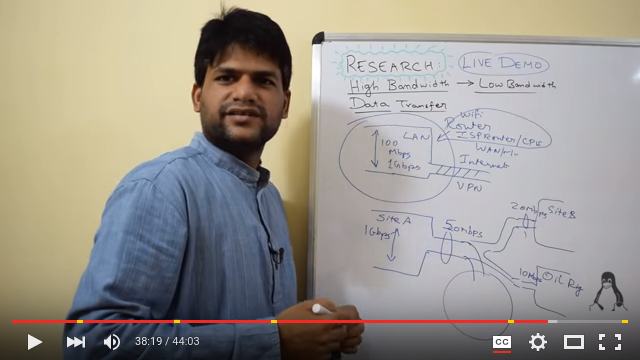
RESEARCH 》 Live demo - Data Transfer - High bandwidth to Low bandwidth
I always wanted to do some real experiments and research on packet flow patterns from High-bandwidth to Low-bandwidth networks via
networking devices. This is something can be analyzed via capturing Network stack buffer data and other parameters, bench-marking, and so on.
But eventually the data-transfer nature and other aspects is often contaminated due to the underlying OS and the way Network stack is implemented.
So to understand the nature of packet flow from Higher to Lower bandwidth and vice-versa such as Lower to higher bandwidth, I thought
I experiment with various tools and things which physically we can observe this phenomena.
What we observe in a software test results is not accurate, Operating system is bound by hardware limitations,
bound by non-real-time digitized instruction processing and other latencies. And if we cannot understand this fundamental concept in
low-speed networks, then we cannot ever understand its complication
in a gigabit or high-speed network. Since the high-speed network processing need even more better hardware and OS capabilities.
In this case let us assume everything we are trying to experiment is in OS layer (i.e) not in a dedicated hardware or a complete
hardware packet processing platform.
At times there are cases when packet processing happens in Linux Kernel networking subsystem, at each phase there can be a packet buffer or a packet queue. This "phase" can be a module or a sub-module or a component or individual tiny network stacks and so on. So whenever such a packet queue exists we can assume it almost represents a funnel. Since a funnel will have a interface or guide or hole to pour water/liquid. This is similar to packets getting added to the packet queue. And the funnel has the bottom hole or interface where the liquid pours out (exits) of funnel. This again represents a packet queue where the stored packets are taken out (or fetched) and sent out for further processing. The amount of time liquid spends inside the funnel or the size of funnel more or less represents the packet queue length. It is quite common that we can change these parameters in Linux Kernel via /proc interface.
Suppose if you do the ifconfig command you can find the default txqueuelen parameter.
kiran@desktop-i7-5820k:~$ ifconfig
enx00808e8e90f4 Link encap:Ethernet  HWaddr 00:80:8e:8e:90:f4
          UP BROADCAST MULTICAST  MTU:1500  Metric:1
          RX packets:0 errors:0 dropped:0 overruns:0 frame:0
          TX packets:0 errors:0 dropped:0 overruns:0 carrier:0
          collisions:0 txqueuelen:1000
          RX bytes:0 (0.0 B)  TX bytes:0 (0.0 B)

eth0      Link encap:Ethernet  HWaddr fc:aa:14:98:cb:66
          inet addr:192.168.0.101  Bcast:192.168.0.255  Mask:255.255.255.0
          inet6 addr: fe80::feaa:14ff:fe98:cb66/64 Scope:Link
          UP BROADCAST RUNNING MULTICAST  MTU:1500  Metric:1
          RX packets:156020 errors:0 dropped:0 overruns:0 frame:0
          TX packets:104413 errors:0 dropped:0 overruns:0 carrier:0
          collisions:0 txqueuelen:1000
          RX bytes:165547621 (165.5 MB)  TX bytes:15061686 (15.0 MB)
          Interrupt:20 Memory:fb100000-fb120000

lo        Link encap:Local Loopback
          inet addr:127.0.0.1  Mask:255.0.0.0
          inet6 addr: ::1/128 Scope:Host
          UP LOOPBACK RUNNING  MTU:65536  Metric:1
          RX packets:65256 errors:0 dropped:0 overruns:0 frame:0
          TX packets:65256 errors:0 dropped:0 overruns:0 carrier:0
          collisions:0 txqueuelen:0
          RX bytes:8107654 (8.1 MB)  TX bytes:8107654 (8.1 MB)
In this case the "eth0" interface is my inbuilt motherboard Gigabit Ethernet NIC card. "enx00808e8e90f4" is my USB2 to 100Mbps Ethernet
NIC card adapter. And the "lo" is the local host. You can notice the txqueuelen is 1000. txqueuelen is nothing but TX (transmit) queue length.
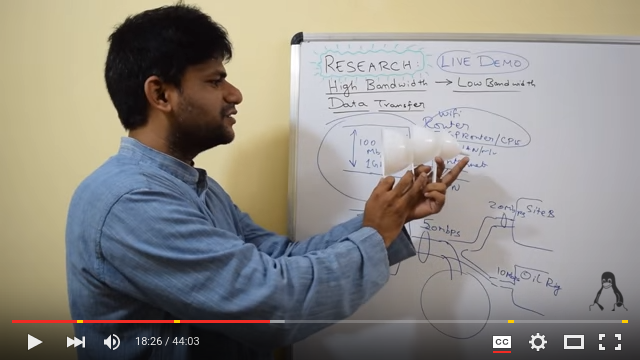
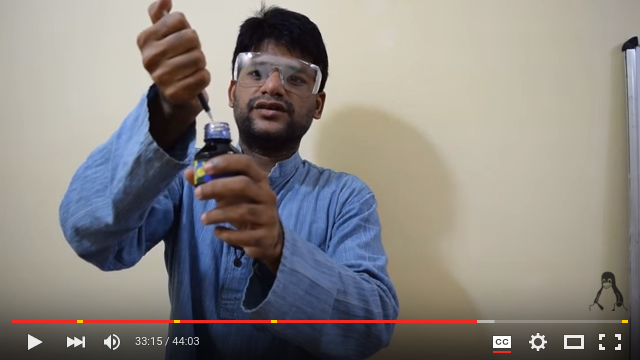
Although as end-users you may see only this in the outside world. But within the Linux kernel you may find packet queues at intermediate levels
too. And this almost look like cascading funnels. And each time the funnel sizes varies. This is the reason I took this screenshot of my
research video where I am trying to show how they cascade.
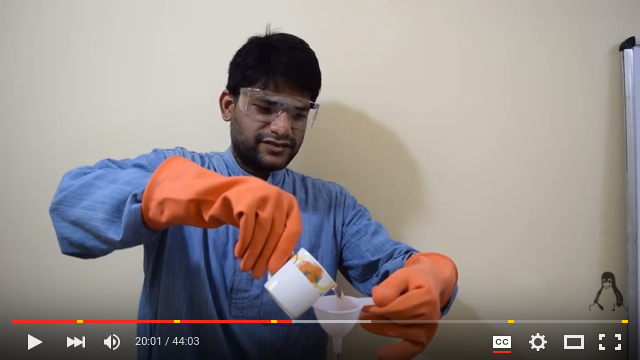
Now lets assume you hold a funnel (of average size) as shown and pour water from a tea cup. The capacity of the tea cup is almost the
same as funnel's capacity. No matter how fast you pour water, the water never overflows from the top of the funnel brim. This is almost the
same case as producer-consumer situation. Where producer-consumer is at the same rate. This is optimal and a good sign.
Note: to highlight the water in the video, I have added red fountain pen ink in the water. So that it is clearly visible.
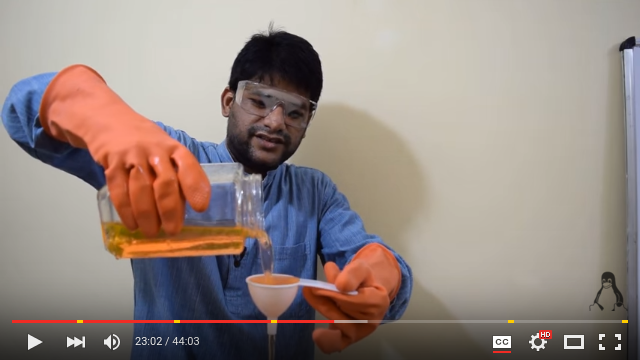
Now let us imagine we pour water with a large jar as shown in the screenshot. The funnel size is the same, but the water is now being added at a higher rate than what funnel can handle. In this case after a certain point the water will start to overflow from the funnel's top brim. This represents the lack of processing power in your networking device, than the network bandwidth or in other words you are receiving packets at higher rate but you lack the processing power, and at the same time your packet buffers are NOT configured optimally. And the overflow of water from the top of the funnel's brim represents packet drops.
Remember always packet drops happens in a device:
- anytime if there is congestion
- if there is data flow from high bandwidth to low-bandwidth
- some processing delays
- inadequate buffer capacity (buffer overflow)
- and so on
In the same way now lets experiment with a small syringe such as Insulin syringe. Insulin syringes have extremely fine needle.
And this is a perfect way to obstruct (or add resistance) to liquid flow. As shown in the screenshot each time you such the ink inside
the syringe, once you pull the piston, the ink will continue to flow into the syringe although you stopped pulling the piston.
This is due to the vacuum created inside and the needle is extremely small to feed the ink quickly. Same way whenever you push the piston,
the ink will come out of the syringe slowly and continue to come out of the syringe although you stopped pressing the piston. This is due
to the high-pressure inside the syringe and extremely small needle. Infact this is what we can observe in electronic transistors, MOSFETs,
vacuum tubes etc dynamically restricting the flow of electrons as well amplifying the electron flow.
So this gives a physical visualization of packet flow in a networking device. Especially cases like networking ports having different bandwidths. As well a case assume you are processing these packets say suppose it is a VPN device, WAN Optimization device, HTTP caching device and so on. The processing of packets adds latency, which means adds resistance to the packet flow. In such cases the Network stack parameters needs to be configured to get optimal performance. Especially the Network packet buffers and so on. And sometimes selecting the right hardware (CPU/RAM/ and so on). So I captured these aspects in a complete video so that my experiments and research may help you to understand these concepts and better architect your Networking components.
Here is the Youtube video link of my complete research:
Suggested Topics:
WAN Optimization and Network Optimization
| 💎 TOFFEE-MOCHA new bootable ISO: | Download |
| 💎 TOFFEE Data-Center Big picture and Overview: | Download PDF |
Bufferbloat in a Networking Device or an Appliance ↗
Saturday' 13-Mar-2021
TOFFEE-Mocha WAN emulator Lab deployment and topology guide ↗
Saturday' 13-Mar-2021
Demo TOFFEE-DataCenter WAN Optimization VM Test Setup ↗
Saturday' 13-Mar-2021
iPerf Network Optimization - WAN Optimization Demo ↗
Saturday' 13-Mar-2021


Featured Educational Video:
iPerf Network Optimization - WAN Optimization Demo ↗
Saturday' 13-Mar-2021

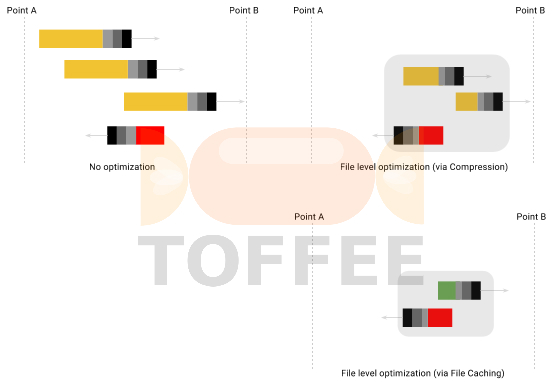
Research :: Optimization of network data (WAN Optimization) at various levels:
Learn Linux Systems Software and Kernel Programming:

Hardware Compression and Decompression Accelerator Cards:
![TOFFEE Architecture with Compression and Decompression Accelerator Card [CDN]](http://sareesaremypassion.org/cdn/the-toffee-project/i/DOCUMENTATION/33/TOFFEE%20compression%20hardware.png "TOFFEE Architecture with Compression and Decompression Accelerator Card [CDN]")
TOFFEE-DataCenter on a Dell Server - Intel Xeon E5645 CPU:
