DOCUMENTATION 》 TEST CASES :: TEST RESULTS :: Raspberry Pi WAN Emulator TOFFEE-Mocha-1.0.14-1-rpi2
Here are my test cases and test results of Raspberry Pi TOFFEE-Mocha
(version: TOFFEE-Mocha-1.0.14-1-rpi2)
WAN Emulator build.
I have connected two laptops as shown below via TOFFEE-Mocha Raspberry Pi2 device. I did these test cases to assess TOFFEE-Mocha,
test its existing features, find and fix bugs if any, as well as a part of my routine research and analysis. It is connected via 100Mbps network
since the Raspberry Pi2 supports only 100Mbps Ethernet as well my other USB2 to 100Mbps Ethernet adapter connected to it.

The DELL Laptop is installed with Apache2 web-server. And in the /var/www/html/videos/xaa file is copied. Which is a fragment of video file of size exactly 500MB.
Basic Test criteria:
The intent of all the test cases is to do few ping tests from HP Laptop to DELL Laptop via Raspberry Pi
TOFFEE-Mocha device. And followed by a wget copy/download (via HTTP Protocol) of the xaa file from DELL Laptop via Raspberry Pi TOFFEE-Mocha device.
And in each test case the same two tests are repeated while enabling various WAN emulation features supported in TOFFEE-Mocha (TOFFEE-Mocha-1.0.14-1-rpi2).
Finally compare all test cases with the first test case (Test case1). Test case 1 is the reference test case in which no TOFFEE-Mocha WAN Emulation
features are enabled in the TOFFEE-Mocha Raspberry Pi device.
Test case1 :: All TOFFEE-Mocha WAN Emulation features are disabled:
This is the first case in which all the TOFFEE-Mocha WAN Emulation
features are disabled. Only Linux Kernel network bridging is created via TOFFEE-Mocha to facilitate to-and-fro packet flow between my HP and DELL laptops.
kiran@HP-ENVY-15:~/temp$ ping 192.168.0.100 -s 1200
PING 192.168.0.100 (192.168.0.100) 1200(1228) bytes of data.
1208 bytes from 192.168.0.100: icmp_seq=1 ttl=64 time=2.19 ms
1208 bytes from 192.168.0.100: icmp_seq=2 ttl=64 time=1.70 ms
1208 bytes from 192.168.0.100: icmp_seq=3 ttl=64 time=1.71 ms
1208 bytes from 192.168.0.100: icmp_seq=4 ttl=64 time=1.64 ms
1208 bytes from 192.168.0.100: icmp_seq=5 ttl=64 time=1.72 ms
1208 bytes from 192.168.0.100: icmp_seq=6 ttl=64 time=1.67 ms
1208 bytes from 192.168.0.100: icmp_seq=7 ttl=64 time=1.72 ms
1208 bytes from 192.168.0.100: icmp_seq=8 ttl=64 time=1.71 ms
1208 bytes from 192.168.0.100: icmp_seq=9 ttl=64 time=1.68 ms
1208 bytes from 192.168.0.100: icmp_seq=10 ttl=64 time=1.72 ms
^C
--- 192.168.0.100 ping statistics ---
10 packets transmitted, 10 received, 0% packet loss, time 9015ms
rtt min/avg/max/mdev = 1.647/1.752/2.199/0.159 ms
kiran@HP-ENVY-15:~/temp$
kiran@HP-ENVY-15:~/temp$ wget http://192.168.0.100/videos/xaa
--2016-06-27 10:59:20--  http://192.168.0.100/videos/xaa
Connecting to 192.168.0.100:80... connected.
HTTP request sent, awaiting response... 200 OK
Length: 524288000 (500M)
Saving to: ‘xaa’

xaa                                  100%[===================================================================>] 500.00M  4.90MB/s    in 72s


2016-06-27 11:00:32 (6.90 MB/s) - ‘xaa’ saved [524288000/524288000]

kiran@HP-ENVY-15:~/temp$
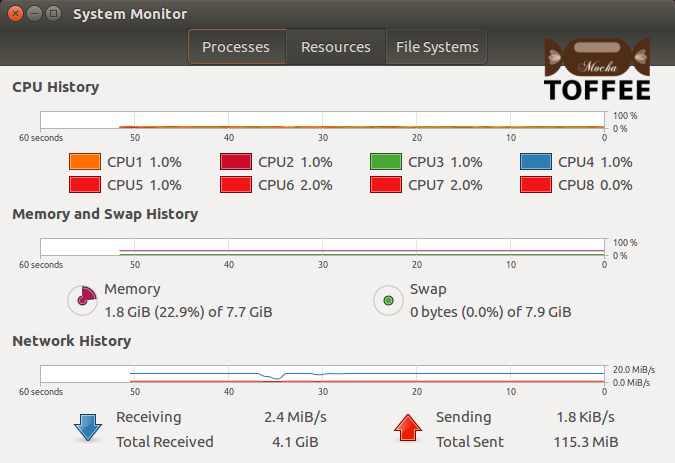
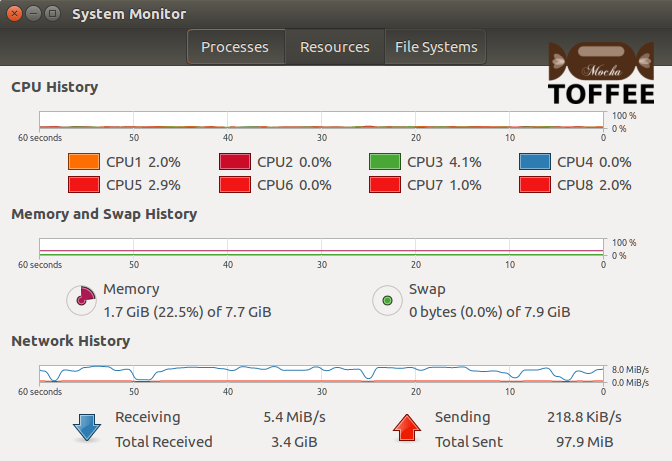
Here is the screenshot of the System Monitor Networking stats captured in my HP Laptop. Notice the blue curve (Network History)
in the graph which denotes constant flow of packets with few glitches here and there.
Test case2:
Constant packet delay: 1-millisecond and 0-microseconds
Dynamic packet delay disabled. Random packet drop disabled
This is a constant 1-millisecond packet delay. As you can see below there is a performance drop in both ping tests as well in the xaa wget file download.
kiran@HP-ENVY-15:~/temp$ ping 192.168.0.100 -s 1200
PING 192.168.0.100 (192.168.0.100) 1200(1228) bytes of data.
1208 bytes from 192.168.0.100: icmp_seq=1 ttl=64 time=3.73 ms
1208 bytes from 192.168.0.100: icmp_seq=2 ttl=64 time=3.63 ms
1208 bytes from 192.168.0.100: icmp_seq=3 ttl=64 time=3.65 ms
1208 bytes from 192.168.0.100: icmp_seq=4 ttl=64 time=3.71 ms
1208 bytes from 192.168.0.100: icmp_seq=5 ttl=64 time=3.70 ms
1208 bytes from 192.168.0.100: icmp_seq=6 ttl=64 time=3.90 ms
1208 bytes from 192.168.0.100: icmp_seq=7 ttl=64 time=3.56 ms
1208 bytes from 192.168.0.100: icmp_seq=8 ttl=64 time=3.69 ms
1208 bytes from 192.168.0.100: icmp_seq=9 ttl=64 time=3.74 ms
1208 bytes from 192.168.0.100: icmp_seq=10 ttl=64 time=3.67 ms
^C
--- 192.168.0.100 ping statistics ---
10 packets transmitted, 10 received, 0% packet loss, time 9014ms
rtt min/avg/max/mdev = 3.562/3.702/3.902/0.099 ms
kiran@HP-ENVY-15:~/temp$
kiran@HP-ENVY-15:~/temp$ wget http://192.168.0.100/videos/xaa
--2016-06-27 11:06:33--  http://192.168.0.100/videos/xaa
Connecting to 192.168.0.100:80... connected.
HTTP request sent, awaiting response... 200 OK
Length: 524288000 (500M)
Saving to: ‘xaa’

xaa                                  100%[===================================================================>] 500.00M   889KB/s    in 9m 37s

2016-06-27 11:16:10 (887 KB/s) - ‘xaa’ saved [524288000/524288000]

kiran@HP-ENVY-15:~/temp$
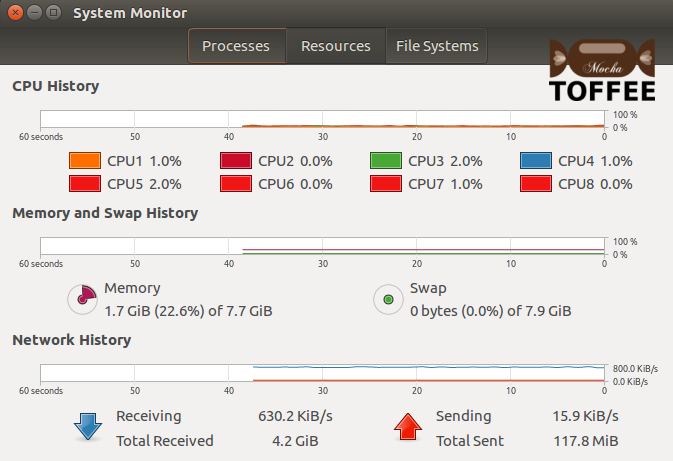
Notice the blue curve(Network History). The overall performance dropped to around 800KB/s.
Test case3:
Constant packet delay: 1-millisecond and 500-microseconds
Dynamic packet delay disabled. Random packet drop disabled
This is a constant 1-millisecond and 500-microseconds (which is 1.5millisecond) packet delay. As you can see below there is a performance drop in both ping tests
as well in the xaa wget file download.
kiran@HP-ENVY-15:~/temp$ ping 192.168.0.100 -s 1200
PING 192.168.0.100 (192.168.0.100) 1200(1228) bytes of data.
1208 bytes from 192.168.0.100: icmp_seq=1 ttl=64 time=4.66 ms
1208 bytes from 192.168.0.100: icmp_seq=2 ttl=64 time=4.70 ms
1208 bytes from 192.168.0.100: icmp_seq=3 ttl=64 time=4.69 ms
1208 bytes from 192.168.0.100: icmp_seq=4 ttl=64 time=4.60 ms
1208 bytes from 192.168.0.100: icmp_seq=5 ttl=64 time=4.69 ms
1208 bytes from 192.168.0.100: icmp_seq=6 ttl=64 time=4.72 ms
1208 bytes from 192.168.0.100: icmp_seq=7 ttl=64 time=4.73 ms
1208 bytes from 192.168.0.100: icmp_seq=8 ttl=64 time=4.81 ms
^C
--- 192.168.0.100 ping statistics ---
8 packets transmitted, 8 received, 0% packet loss, time 7012ms
rtt min/avg/max/mdev = 4.605/4.705/4.813/0.073 ms
kiran@HP-ENVY-15:~/temp$
kiran@HP-ENVY-15:~/temp$ wget http://192.168.0.100/videos/xaa
--2016-06-27 11:17:54--  http://192.168.0.100/videos/xaa
Connecting to 192.168.0.100:80... connected.
HTTP request sent, awaiting response... 200 OK
Length: 524288000 (500M)
Saving to: ‘xaa’

xaa                                  100%[===================================================================>] 500.00M   602KB/s    in 14m 16s

2016-06-27 11:32:10 (598 KB/s) - ‘xaa’ saved [524288000/524288000]

kiran@HP-ENVY-15:~/temp$
Test case4:
Constant packet delay: 0-millisecond and 0-microsecond
Dynamic packet delay enabled (factor 1). Random packet drops disabled
In this case constant packet delay is disabled and dynamic packet delay is enabled with dynamic delay factor 1. If the dynamic delay factor is 1 then the dynamic
delay is more proportional to the size of the packet. Hence you can see there is a huge performance drop in the ping packets. As well stable performance drop in
the wget xaa file download. Since it is a large 500MB file download, so the performance drop is fairly constant without much fluctuations. But in real world scenario,
assume you are doing casual browsing and large folder with 100s of small file downloads, in those cases you may experience burst-like network performance.
Since small packets are transferred without any significant delay and large near MTU sized packets are proportionally delayed.
kiran@HP-ENVY-15:~/temp$ ping 192.168.0.100 -s 1200
PING 192.168.0.100 (192.168.0.100) 1200(1228) bytes of data.
1208 bytes from 192.168.0.100: icmp_seq=1 ttl=64 time=4.09 ms
1208 bytes from 192.168.0.100: icmp_seq=2 ttl=64 time=4.17 ms
1208 bytes from 192.168.0.100: icmp_seq=3 ttl=64 time=4.15 ms
1208 bytes from 192.168.0.100: icmp_seq=4 ttl=64 time=4.09 ms
1208 bytes from 192.168.0.100: icmp_seq=5 ttl=64 time=4.13 ms
1208 bytes from 192.168.0.100: icmp_seq=6 ttl=64 time=4.19 ms
1208 bytes from 192.168.0.100: icmp_seq=7 ttl=64 time=4.19 ms
1208 bytes from 192.168.0.100: icmp_seq=8 ttl=64 time=4.29 ms
^C
--- 192.168.0.100 ping statistics ---
8 packets transmitted, 8 received, 0% packet loss, time 7008ms
rtt min/avg/max/mdev = 4.091/4.167/4.295/0.061 ms
kiran@HP-ENVY-15:~/temp$
kiran@HP-ENVY-15:~/temp$ wget http://192.168.0.100/videos/xaa
--2016-06-27 11:35:32--  http://192.168.0.100/videos/xaa
Connecting to 192.168.0.100:80... connected.
HTTP request sent, awaiting response... 200 OK
Length: 524288000 (500M)
Saving to: ‘xaa’

xaa                                  100%[===================================================================>] 500.00M   887KB/s    in 9m 39s

2016-06-27 11:45:11 (884 KB/s) - ‘xaa’ saved [524288000/524288000]

kiran@HP-ENVY-15:~/temp$
Test case5:
Constant packet delay: 0-millisecond and 0-microsecond
Dynamic packet delay enabled (factor 2). Random packet drops disabled
Same test case as above (i.e Test case 4) but with dynamic delay factor 2. This cuts down the exponential dynamic delay proportional to the packet size.
And hence there is better network performance compared with test case 4. But in general you may experience similar network performance characteristics dynamically
as test-case 4, but in this case little less significant.
kiran@HP-ENVY-15:~/temp$ ping 192.168.0.100 -s 1200
PING 192.168.0.100 (192.168.0.100) 1200(1228) bytes of data.
1208 bytes from 192.168.0.100: icmp_seq=1 ttl=64 time=2.86 ms
1208 bytes from 192.168.0.100: icmp_seq=2 ttl=64 time=2.88 ms
1208 bytes from 192.168.0.100: icmp_seq=3 ttl=64 time=2.96 ms
1208 bytes from 192.168.0.100: icmp_seq=4 ttl=64 time=2.91 ms
1208 bytes from 192.168.0.100: icmp_seq=5 ttl=64 time=2.88 ms
1208 bytes from 192.168.0.100: icmp_seq=6 ttl=64 time=2.85 ms
1208 bytes from 192.168.0.100: icmp_seq=7 ttl=64 time=2.92 ms
1208 bytes from 192.168.0.100: icmp_seq=8 ttl=64 time=2.89 ms
1208 bytes from 192.168.0.100: icmp_seq=9 ttl=64 time=2.89 ms
^C
--- 192.168.0.100 ping statistics ---
9 packets transmitted, 9 received, 0% packet loss, time 8014ms
rtt min/avg/max/mdev = 2.858/2.898/2.967/0.059 ms
kiran@HP-ENVY-15:~/temp$
kiran@HP-ENVY-15:~/temp$ wget http://192.168.0.100/videos/xaa
--2016-06-27 11:46:47--  http://192.168.0.100/videos/xaa
Connecting to 192.168.0.100:80... connected.
HTTP request sent, awaiting response... 200 OK
Length: 524288000 (500M)
Saving to: ‘xaa’

xaa                                  100%[===================================================================>] 500.00M  1.67MB/s    in 5m 2s

2016-06-27 11:51:49 (1.66 MB/s) - ‘xaa’ saved [524288000/524288000]

kiran@HP-ENVY-15:~/temp$
Test case6:
Constant packet delay: 0-millisecond and 0-microsecond
Dynamic packet delay disabled. Random packet drop enabled (factor 1)
In this case both dynamic and constant delay features are disabled and random packet drop is enabled with random drop factor 1 option. With this setting you may
not notice much issues in ping performance as you can see below. This ping performance is almost the same as Test case 1 (i.e no WAN Emulation settings enabled
in TOFFEE-Mocha). But you may notice a drastic file download performance degrade. You can control this via drop factor variable. In this case it is value 1.
So there is excess packet loss. This will add confusion in TCP connection(s) and hence you will get extremely unpredictable dynamic performance.
kiran@HP-ENVY-15:~/temp$ ping 192.168.0.100 -s 1200
PING 192.168.0.100 (192.168.0.100) 1200(1228) bytes of data.
1208 bytes from 192.168.0.100: icmp_seq=1 ttl=64 time=1.69 ms
1208 bytes from 192.168.0.100: icmp_seq=3 ttl=64 time=1.74 ms
1208 bytes from 192.168.0.100: icmp_seq=4 ttl=64 time=1.97 ms
1208 bytes from 192.168.0.100: icmp_seq=5 ttl=64 time=1.79 ms
1208 bytes from 192.168.0.100: icmp_seq=6 ttl=64 time=1.71 ms
1208 bytes from 192.168.0.100: icmp_seq=7 ttl=64 time=1.74 ms
1208 bytes from 192.168.0.100: icmp_seq=8 ttl=64 time=1.73 ms
1208 bytes from 192.168.0.100: icmp_seq=9 ttl=64 time=1.70 ms
1208 bytes from 192.168.0.100: icmp_seq=11 ttl=64 time=1.71 ms
1208 bytes from 192.168.0.100: icmp_seq=12 ttl=64 time=1.66 ms
1208 bytes from 192.168.0.100: icmp_seq=13 ttl=64 time=1.71 ms
^C
--- 192.168.0.100 ping statistics ---
13 packets transmitted, 11 received, 15% packet loss, time 12015ms
rtt min/avg/max/mdev = 1.661/1.745/1.970/0.077 ms
kiran@HP-ENVY-15:~/temp$
kiran@HP-ENVY-15:~/temp$ wget http://192.168.0.100/videos/xaa
--2016-06-27 11:54:40--  http://192.168.0.100/videos/xaa
Connecting to 192.168.0.100:80... connected.
HTTP request sent, awaiting response... 200 OK
Length: 524288000 (500M)
Saving to: ‘xaa’

xaa                                  100%[===================================================================>] 500.00M   663KB/s    in 12m 25s

2016-06-27 12:07:04 (687 KB/s) - ‘xaa’ saved [524288000/524288000]

kiran@HP-ENVY-15:~/temp$
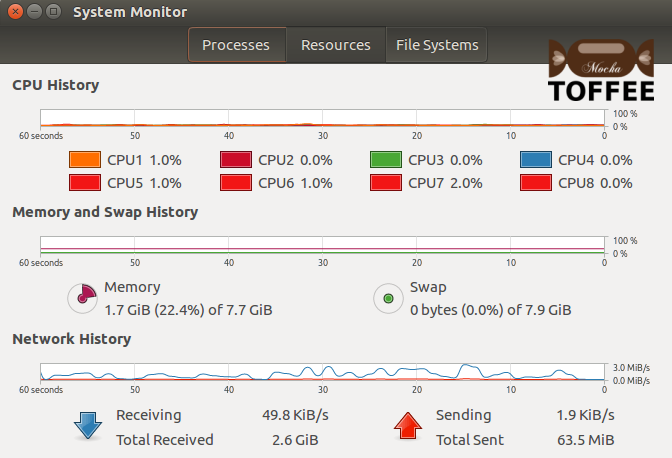
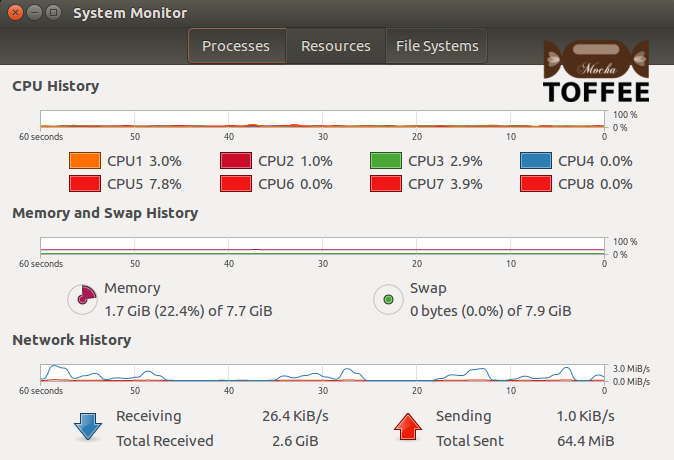
Notice the blue curve (Network History) which is completely fluctuating. You get extremely bad and unpredictable performance. Notice the second screenshot,
where it sometimes halts the packet transfer due to the confusion caused by random packet drop.
Test case7:
Constant packet delay: 0-millisecond and 0-microsecond
Dynamic packet delay disabled. Random packet drop enabled (factor 2)
Same as Test case 6, but in this case the random packet drop factor is value 2.
This means the probability of packet drop (packet loss) is lesser than drop factor 1. So similar to Test case 6, you may not notice any significant ping
performance issues. But in the wget xaa file download, you may notice now it is somewhat better than test case 6. There is less confusion in the link/connectivity,
and hence better network performance and so less turbulence.
kiran@HP-ENVY-15:~/temp$ ping 192.168.0.100 -s 1200
PING 192.168.0.100 (192.168.0.100) 1200(1228) bytes of data.
1208 bytes from 192.168.0.100: icmp_seq=1 ttl=64 time=1.66 ms
1208 bytes from 192.168.0.100: icmp_seq=2 ttl=64 time=1.71 ms
1208 bytes from 192.168.0.100: icmp_seq=3 ttl=64 time=1.77 ms
1208 bytes from 192.168.0.100: icmp_seq=4 ttl=64 time=1.78 ms
1208 bytes from 192.168.0.100: icmp_seq=5 ttl=64 time=1.78 ms
1208 bytes from 192.168.0.100: icmp_seq=6 ttl=64 time=1.62 ms
1208 bytes from 192.168.0.100: icmp_seq=7 ttl=64 time=1.66 ms
1208 bytes from 192.168.0.100: icmp_seq=8 ttl=64 time=1.73 ms
1208 bytes from 192.168.0.100: icmp_seq=9 ttl=64 time=1.71 ms
^C
--- 192.168.0.100 ping statistics ---
9 packets transmitted, 9 received, 0% packet loss, time 8014ms
rtt min/avg/max/mdev = 1.629/1.717/1.781/0.060 ms
kiran@HP-ENVY-15:~/temp$
kiran@HP-ENVY-15:~/temp$ wget http://192.168.0.100/videos/xaa
--2016-06-27 12:10:13--  http://192.168.0.100/videos/xaa
Connecting to 192.168.0.100:80... connected.
HTTP request sent, awaiting response... 200 OK
Length: 524288000 (500M)
Saving to: ‘xaa’

xaa                                  100%[===================================================================>] 500.00M  5.96MB/s    in 95s

2016-06-27 12:11:48 (5.28 MB/s) - ‘xaa’ saved [524288000/524288000]

kiran@HP-ENVY-15:~/temp$
Notice the blue curve (Network History), the network performance is now improved compared to the test case 6. You can notice due to still existing random packet drop (although less compared to test case 6), there is a dynamic network fluctuating performance.
So these are the various test cases I tested casually. The intent is not to try all combinations of TOFFEE-Mocha features. But the intent is to test how far these features are going to affect the real-time simulated WAN network performance. And as well to understand which combination of settings need to be set for any given WAN network simulation, such as Mobile networks, Satellite networks, inflight WiFi and so on.
Предлагаемые темы:
TOFFEE-Mocha - WAN Emulator
Categories
| 💎 TOFFEE-MOCHA new bootable ISO: | Download |
| 💎 TOFFEE Data-Center Big picture and Overview: | Download PDF |

Saturday' 13-Mar-2021

Saturday' 13-Mar-2021

Saturday' 13-Mar-2021

Saturday' 13-Mar-2021
Featured Educational Video:

Saturday' 13-Mar-2021
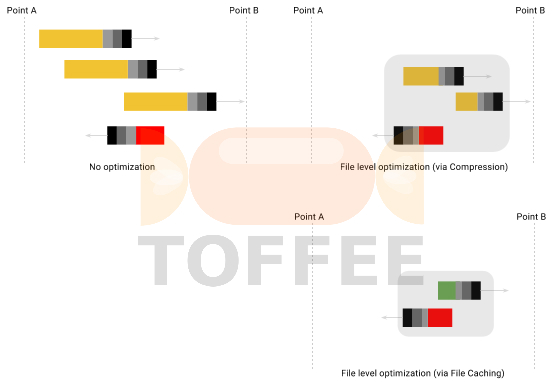
Research :: Optimization of network data (WAN Optimization) at various levels:
Learn Linux Systems Software and Kernel Programming:

Hardware Compression and Decompression Accelerator Cards:

TOFFEE-DataCenter on a Dell Server - Intel Xeon E5645 CPU:


